Datei:US Federal Debt as Percent of GDP by President.jpg
Zur Navigation springen
Zur Suche springen

Größe dieser Vorschau: 800 × 492 Pixel. Weitere Auflösungen: 320 × 197 Pixel | 640 × 393 Pixel | 965 × 593 Pixel
Originaldatei (965 × 593 Pixel, Dateigröße: 108 KB, MIME-Typ: image/jpeg)
![]()
Diese Datei und die Informationen unter dem roten Trennstrich werden aus dem zentralen Medienarchiv Wikimedia Commons eingebunden.
![]()
Beschreibung
| Beschreibung |
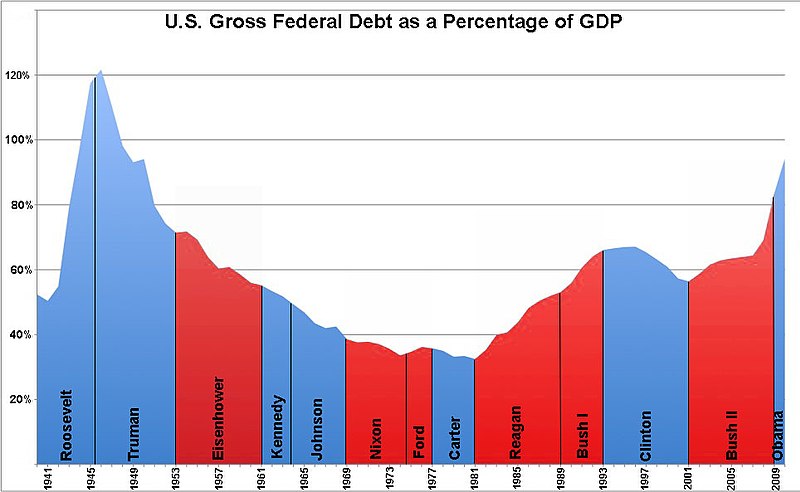
English: This is a graph of U.S. gross federal government debt from 1940 to 2010, as a percentage of GDP, broken down by presidential terms. The data is from the U.S. Office of Management and Budget (http://www.whitehouse.gov/sites/default/files/omb/budget/fy2011/assets/hist07z1.xls).
Replaced by File:US_Federal_Debt_as_Percent_of_GDP_by_President.png |
| Datum | |
| Quelle | Eigenes Werk |
| Urheber | CircleAdrian & Michael Adams |
| Andere Versionen | US_Federal_Debt_as_Percent_of_GDP_by_President.png |

|
File:US Federal Debt as Percent of GDP by President.svg ist eine vektorisierte Version dieses Bildes. Diese sollte an Stelle des Rasterbildes verwendet werden, sofern sie nicht schlechter ist.
File:US Federal Debt as Percent of GDP by President.jpg → File:US Federal Debt as Percent of GDP by President.svg
Für weitere Informationen siehe Help:SVG. |
 |
Lizenz
| Ich, der Urheberrechtsinhaber dieses Werkes, veröffentliche es als gemeinfrei. Dies gilt weltweit. In manchen Staaten könnte dies rechtlich nicht möglich sein. Sofern dies der Fall ist: Ich gewähre jedem das bedingungslose Recht, dieses Werk für jedweden Zweck zu nutzen, es sei denn, Bedingungen sind gesetzlich erforderlich. |
Dateiversionen
Klicke auf einen Zeitpunkt, um diese Version zu laden.
| Version vom | Vorschaubild | Maße | Benutzer | Kommentar | |
|---|---|---|---|---|---|
| aktuell | 07:08, 18. Jan. 2011 | | 965 × 593 (108 KB) | ResidentScholar~commonswiki | Reverted to version as of 06:04, 7 April 2010 |
| 12:57, 16. Jan. 2011 |  | 965 × 593 (75 KB) | ResidentScholar~commonswiki | Corrected Bush and Obama figures. Fiscal years and calendar years may be intermixed elsewhere so further revision may be necessary. In this case 69.5% of GDP is the end-of-Fiscal-year debt figure used by the OMB source; I used 74.5% which is the end-of- | |
| 08:04, 7. Apr. 2010 |  | 965 × 593 (108 KB) | CircleAdrian | Increased proportional size of Y-axis, color-coded by presidential term, and took off estimates for dates after 2010 (due to potential inaccuracy). | |
| 11:29, 1. Apr. 2010 | 1.405 × 485 (167 KB) | Unquietwiki | This is a graph of U.S. federal government debt from 1940 to 2015, as a percentage of GDP, broken down by year+President. The data is from the U.S. Office of Management and Budget (http://www.whitehouse.gov/omb/budget/fy2011/assets/hist07z1.xls) [[Catego | ||
| 05:14, 31. Mär. 2010 |  | 856 × 481 (77 KB) | CircleAdrian | {{Information |Description={{en|1=This is a graph of U.S. federal government debt from 1977 to 2009, as a percentage of GDP, broken down by presidential terms. The data is from the U.S. Office of Management and Budget (http://www.whitehouse.gov/omb/budget |
Dateiverwendung
Die folgende Seite verwendet diese Datei:
Globale Dateiverwendung
Die nachfolgenden anderen Wikis verwenden diese Datei:
- Verwendung auf en.wikipedia.org
- Verwendung auf no.wikipedia.org