Datei:Changes in total solar irradiance and monthly sunspot numbers, 1975-2013.png
Zur Navigation springen
Zur Suche springen
Größe dieser Vorschau: 796 × 600 Pixel. Weitere Auflösungen: 319 × 240 Pixel | 637 × 480 Pixel | 1.020 × 768 Pixel | 1.280 × 964 Pixel | 2.318 × 1.746 Pixel
Originaldatei (2.318 × 1.746 Pixel, Dateigröße: 289 KB, MIME-Typ: image/png)
![]()
Diese Datei und die Informationen unter dem roten Trennstrich werden aus dem zentralen Medienarchiv Wikimedia Commons eingebunden.
![]()
Beschreibung
| Beschreibung |
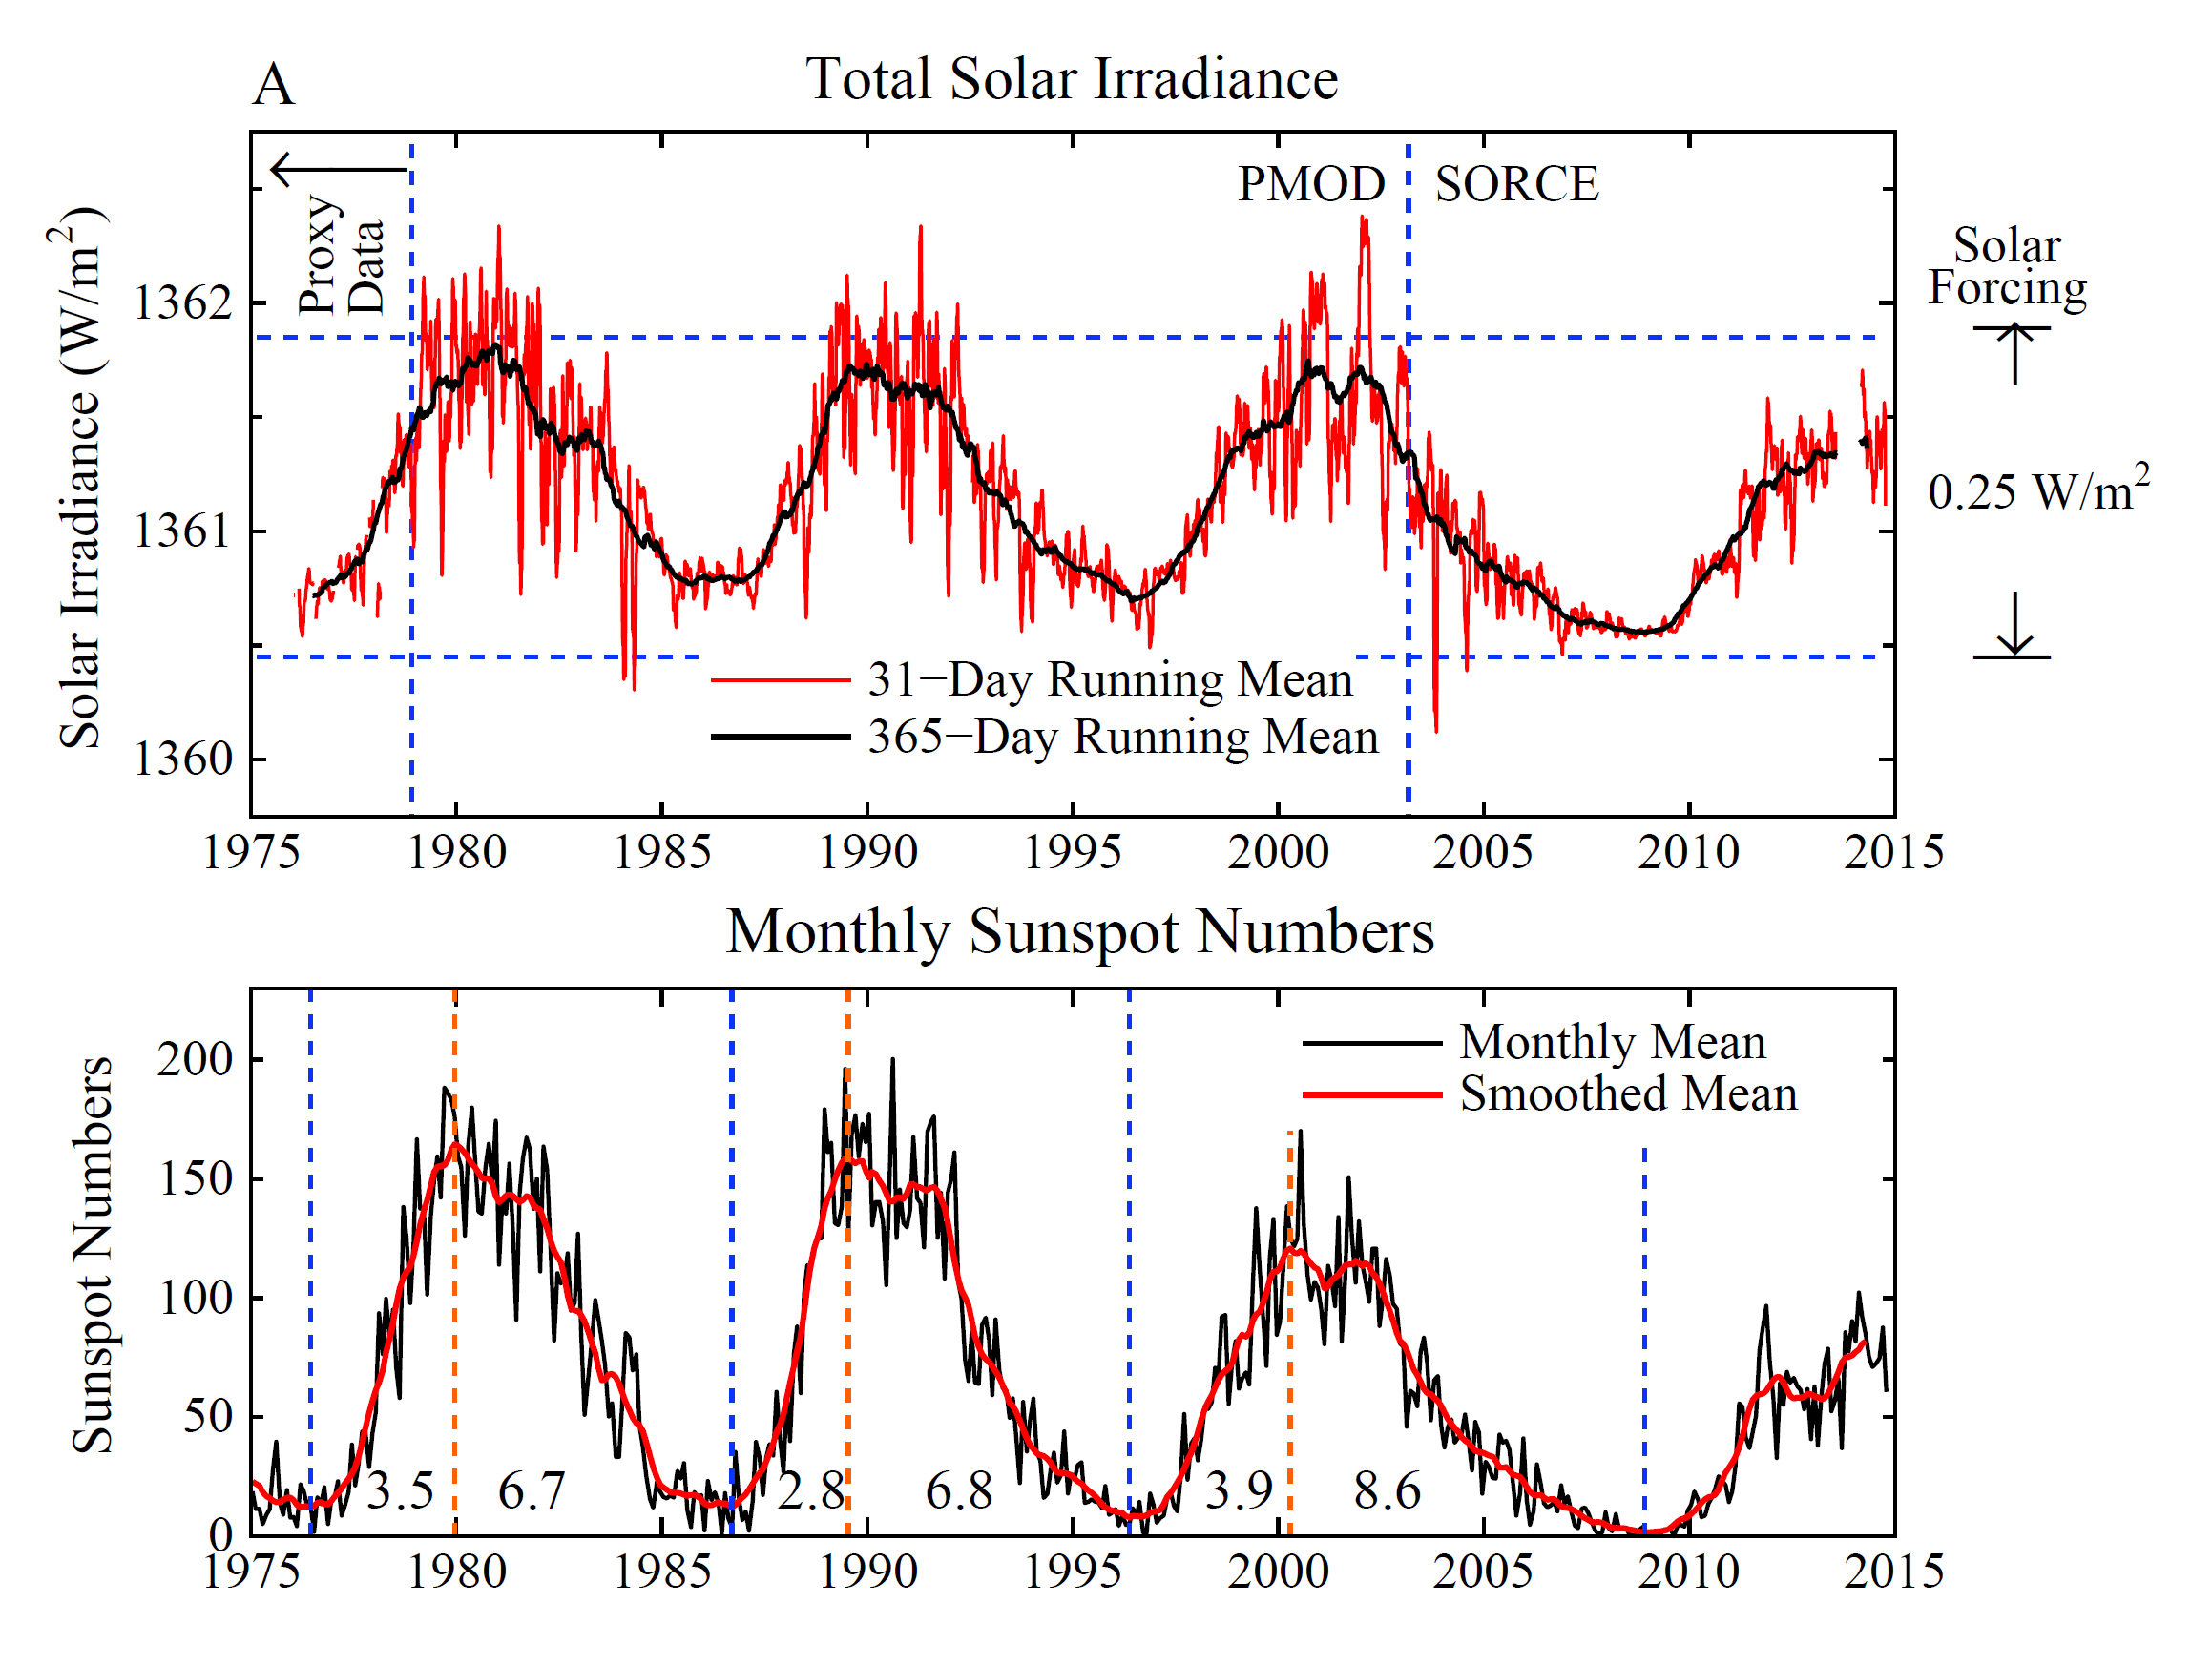
English: These two graphs show changes in total solar irradiance (TSI, labelled "A") and monthly sunspot numbers ("B") between approximately 1975 to 2013. TSI is measured in watts per square metre (W.m-2), with 31-day and 365-day running means plotted. The 31-day mean shows more variability than the 365-day mean. Both curves show a pattern of peaks and troughs (see: solar cycle). The range of changes in solar forcing (365-day mean) over the time period is 0.25 W.m2.
Graph B plots a monthly mean and smoothed mean, with the monthly mean showing more variability than the smoothed mean. The pattern of peaks and troughs in total solar irradiance is replicated in this graph of monthly sunspot numbers. A summary of the data is given in a later section. |
| Datum | |
| Quelle |
|
| Urheber | Hansen J, Kharecha P, Sato M, Masson-Delmotte V, Ackerman F, et al. |
Data
Values are approximate. See Hansen et al. for original data sources. For TSI and monthly sunspot numbers, data are given for the 365-day mean and smoothed mean, respectively. Values are given that correspond to peaks and troughs in the curves, as well as values at the beginning and end of the time period (approximately 1977 and 2014).
| Year | TSI |
|---|---|
| 1977 | 1360.75 |
| 1981 | 1361.85 |
| 1986 | 1360.75 |
| 1991 | 1361.6 |
| 1996 | 1360.75 |
| 2001 | 1361.7 |
| 2009 | 1360.55 |
| 2013 | 1361.35 |
| Year | Sunspot No. |
|---|---|
| 1977 | 15 |
| 1980 | 160 |
| 1987 | 15 |
| 1991 | 145 |
| 1997 | 10 |
| 2001 | 105 |
| 2009 | 3 |
| 2014 | 85 |
Lizenz
| Diese Datei wird unter der Creative-Commons-Lizenz „CC0 1.0 Verzicht auf das Copyright“ zur Verfügung gestellt. | |
| Die Person, die das Werk mit diesem Dokument verbunden hat, übergibt dieses weltweit der Gemeinfreiheit, indem sie alle Urheberrechte und damit verbundenen weiteren Rechte – im Rahmen der jeweils geltenden gesetzlichen Bestimmungen – aufgibt. Das Werk kann – selbst für kommerzielle Zwecke – kopiert, modifiziert und weiterverteilt werden, ohne hierfür um Erlaubnis bitten zu müssen.
|
| Bildnotizen | Diese Datei ist annotiert: Betrachte diese auf Commons. |
Dateiversionen
Klicke auf einen Zeitpunkt, um diese Version zu laden.
| Version vom | Vorschaubild | Maße | Benutzer | Kommentar | |
|---|---|---|---|---|---|
| aktuell | 09:49, 21. Nov. 2014 | | 2.318 × 1.746 (289 KB) | Enescot | {{Information |Description ={{en|1=These two graphs show changes in total solar irradiance (TSI, labelled "A") and monthly sunspot numbers ("B") between approximately 1975 to 2013. TSI is measured in wa... |
Dateiverwendung
Die folgende Seite verwendet diese Datei:
Globale Dateiverwendung
Die nachfolgenden anderen Wikis verwenden diese Datei:
- Verwendung auf es.wikipedia.org
- Verwendung auf ga.wikipedia.org