Zur Beschreibungsseite auf Commons

Datei:1000 Year Temperature Comparison.png

aus Wikipedia, der freien Enzyklopädie
Zur Navigation springen Zur Suche springen

1000_Year_Temperature_Comparison.png(599 × 442 Pixel, Dateigröße: 32 KB, MIME-Typ: image/png)

Diese Datei und die Informationen unter dem roten Trennstrich werden aus dem zentralen Medienarchiv Wikimedia Commons eingebunden.

Zur Beschreibungsseite auf Commons


Dieses Bild des Typs Graph sollte als Vektorgrafik im SVG-Format neu erstellt werden. Vektorformate haben zahlreiche Vorteile; weitere Information unter Commons:Media for cleanup. Wenn dir eine SVG-Version dieses Bildes vorliegt, so lade diese bitte hoch. Nach dem Hochladen der Datei ist diese Vorlage auf der aktuellen Bildbeschreibungsseite durch die Vorlage {{Vector version available}}, oder kürzer {{Vva}}, zu ersetzen. Es ist empfohlen die neue SVG-Datei „1000 Year Temperature Comparison.svg“ zu nennen – dann benötigt die Vorlage vector version available (bzw. vva) keinen Parameter.

Beschreibung

Beschreibung
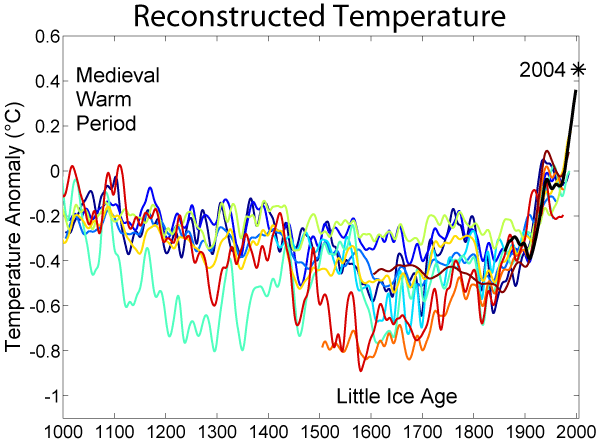
English: This image is a comparison of 10 different published reconstructions of mean temperature changes during the 2nd millennium. More recent reconstructions are plotted towards the front and in redder colors, older reconstructions appear towards the back and in bluer colors. An instrumental history of temperature is also shown in black. The medieval warm period and little ice age are labeled at roughly the times when they are historically believed to occur, though it is still disputed whether these were truly global or only regional events. The single, unsmoothed annual value for 2004 is also shown for comparison. (Image:Instrumental Temperature Record.png shows how 2004 relates to other recent years).

It is unknown which, if any, of these reconstructions is an accurate representation of climate history; however, these curves are a fair representation of the range of results appearing in the published scientific literature. Hence, it is likely that such reconstructions, accurate or not, will play a significant role in the ongoing discussions of global climate change and global warming.

For each reconstruction, the raw data has been decadally smoothed with a σ = 5 yr Gaussian weighted moving average. Also, each reconstruction was adjusted so that its mean matched the mean of the instrumental record during the period of overlap. The variance (i.e. the scale of fluctuations) was not adjusted (except in one case noted below).

Except as noted below, all original data for this comparison comes from here and links therein. It should also be noted that many reconstructions of past climate report substantial error bars, which are not represented on this figure.
Datum
Quelle http://www.globalwarmingart.com/wiki/File:1000_Year_Temperature_Comparison.png
Urheber Robert A. Rohde
Andere Versionen

Reconstructions

The reconstructions used, in order from oldest to most recent publication are:

  1. (dark blue 1000-1991): The Holocene.
  2. (blue 1000-1980): Geophysical Research Letters.
  3. (light blue 1000-1965): Ambio. Modified as published in Science.
  4. (lightest blue 1402-1960): J. Geophys. Res..
  5. (light green 831-1992): Science.
  6. (yellow 200-1980): Geophysical Research Letters. doi:10.1029/2003GL017814.
  7. (orange 200-1995): Reviews of Geophysics. doi:10.1029/2003RG000143
  8. (red-orange 1500-1980): Geophys. Res Lett.. doi:10.1029/2004GL019781
  9. (red 1-1979): Nature. doi:10.1038/nature03265
  10. (dark red 1600-1990): Science. doi:10.1126/science.1107046

(black 1856-2004): Instrumental data was jointly compiled by the Climatic Research Unit and the UK Meteorological Office Hadley Centre. Global Annual Average data set TaveGL2v [1] was used.

Documentation for the most recent update of the CRU/Hadley instrumental data set appears in: Journal of Climate.

Lizenz

The original version of this figure was prepared by Robert A. Rohde from publicly available data and is incorporated into the Global Warming Art project.

Image from Global Warming Art
This image is an original work created for Global Warming Art. Please refer to the Year Temperature Comparison.png image description page for more information.
GNU head Es ist erlaubt, die Datei unter den Bedingungen der GNU-Lizenz für freie Dokumentation, Version 1.2 oder einer späteren Version, veröffentlicht von der Free Software Foundation, zu kopieren, zu verbreiten und/oder zu modifizieren; es gibt keine unveränderlichen Abschnitte, keinen vorderen und keinen hinteren Umschlagtext.

Der vollständige Text der Lizenz ist im Kapitel GNU-Lizenz für freie Dokumentation verfügbar.

w:de:Creative Commons
Namensnennung Weitergabe unter gleichen Bedingungen
Diese Datei ist unter der Creative-Commons-Lizenz „Namensnennung – Weitergabe unter gleichen Bedingungen 3.0 nicht portiert“ lizenziert.
Dieses Werk darf von dir
  • verbreitet werden – vervielfältigt, verbreitet und öffentlich zugänglich gemacht werden
  • neu zusammengestellt werden – abgewandelt und bearbeitet werden
Zu den folgenden Bedingungen:
  • Namensnennung – Du musst angemessene Urheber- und Rechteangaben machen, einen Link zur Lizenz beifügen und angeben, ob Änderungen vorgenommen wurden. Diese Angaben dürfen in jeder angemessenen Art und Weise gemacht werden, allerdings nicht so, dass der Eindruck entsteht, der Lizenzgeber unterstütze gerade dich oder deine Nutzung besonders.
  • Weitergabe unter gleichen Bedingungen – Wenn du das Material wiedermischst, transformierst oder darauf aufbaust, musst du deine Beiträge unter der gleichen oder einer kompatiblen Lizenz wie das Original verbreiten.
Diese Lizenzmarkierung wurde auf Grund der GFDL-Lizenzaktualisierung hinzugefügt.


Notes

  1. Data from Moberg et al. was taken directly from the supplemental information accompanying the Nature article.
  2. Data for Oerlemans was provided by William M. Connolley.
  3. Esper et al. reported only fluctuations in "arbitrary" units, so the variance in this record was rescaled to match the variance during the period of overlap with the instrumental record.
  4. When a paper included multiple reconstructions, the global annually average temperature data was used. If this was not reported, then Northern Hemisphere annually averaged data was used.
  5. Four records appearing at [2] were not used in preparing this graph for the following reasons:
    1. Mann et al. 98 was not included because Mann et al. 99 extended and updated that record.
    2. Briffa et al. 98 was not included because Briffa et al. 2001 extended and updated that record.
    3. Pollack et al. 98 was not included because the reported data was not found to be in a form that allowed for easy replotting.
    4. Mann et al. 2000 was not used because it did not include an original reconstruction covering at least the Northern Hemisphere.


Dragons flight's Temperature Record Series
This figure is part of a series of plots created by Dragons flight to illustrate
changes in Earth's temperature and climate across many different time scales.
Time Period: 25 yrs | 150 yrs | 1 kyr | 2 kyr | 12 kyr | 450 kyr | 5 Myr | 65 Myr | 500 Myr
For articles related to this topic see: Temperature record

Kurzbeschreibungen

Ergänze eine einzeilige Erklärung, was diese Datei darstellt.

In dieser Datei abgebildete Objekte

Motiv

image/png

896104465de636e551cb77de82d0892e1e892551

32.749 Byte

442 Pixel

599 Pixel

Dateiversionen

Klicke auf einen Zeitpunkt, um diese Version zu laden.

Version vomVorschaubildMaßeBenutzerKommentar
aktuell01:14, 22. Nov. 2019Vorschaubild der Version vom 01:14, 22. Nov. 2019599 × 442 (32 KB)MyridiumSomebody updated the image with a "2016" label that isn't even included in the data analysed! Data analysed only goes up to 2004.
08:54, 5. Mai 2019Vorschaubild der Version vom 08:54, 5. Mai 2019599 × 500 (48 KB)TobusUpdate to show 2016 temperature anomaly
19:10, 16. Jul. 2014Vorschaubild der Version vom 19:10, 16. Jul. 2014599 × 442 (32 KB)JeffyPShrinkin' the image.
00:51, 18. Dez. 2005Vorschaubild der Version vom 00:51, 18. Dez. 2005599 × 442 (40 KB)Saperaud~commonswiki*'''Description:''' [[en:Image:{{subst:PAGENAME}}]]

Die folgende Seite verwendet diese Datei:

Globale Dateiverwendung

Die nachfolgenden anderen Wikis verwenden diese Datei: