Datei:Gamma ray dose rate maps of Fukushima Prefecture.jpg
Originaldatei (4.219 × 1.710 Pixel, Dateigröße: 1,05 MB, MIME-Typ: image/jpeg)
![]()
Diese Datei und die Informationen unter dem roten Trennstrich werden aus dem zentralen Medienarchiv Wikimedia Commons eingebunden.
![]()
Beschreibung
| Beschreibung |
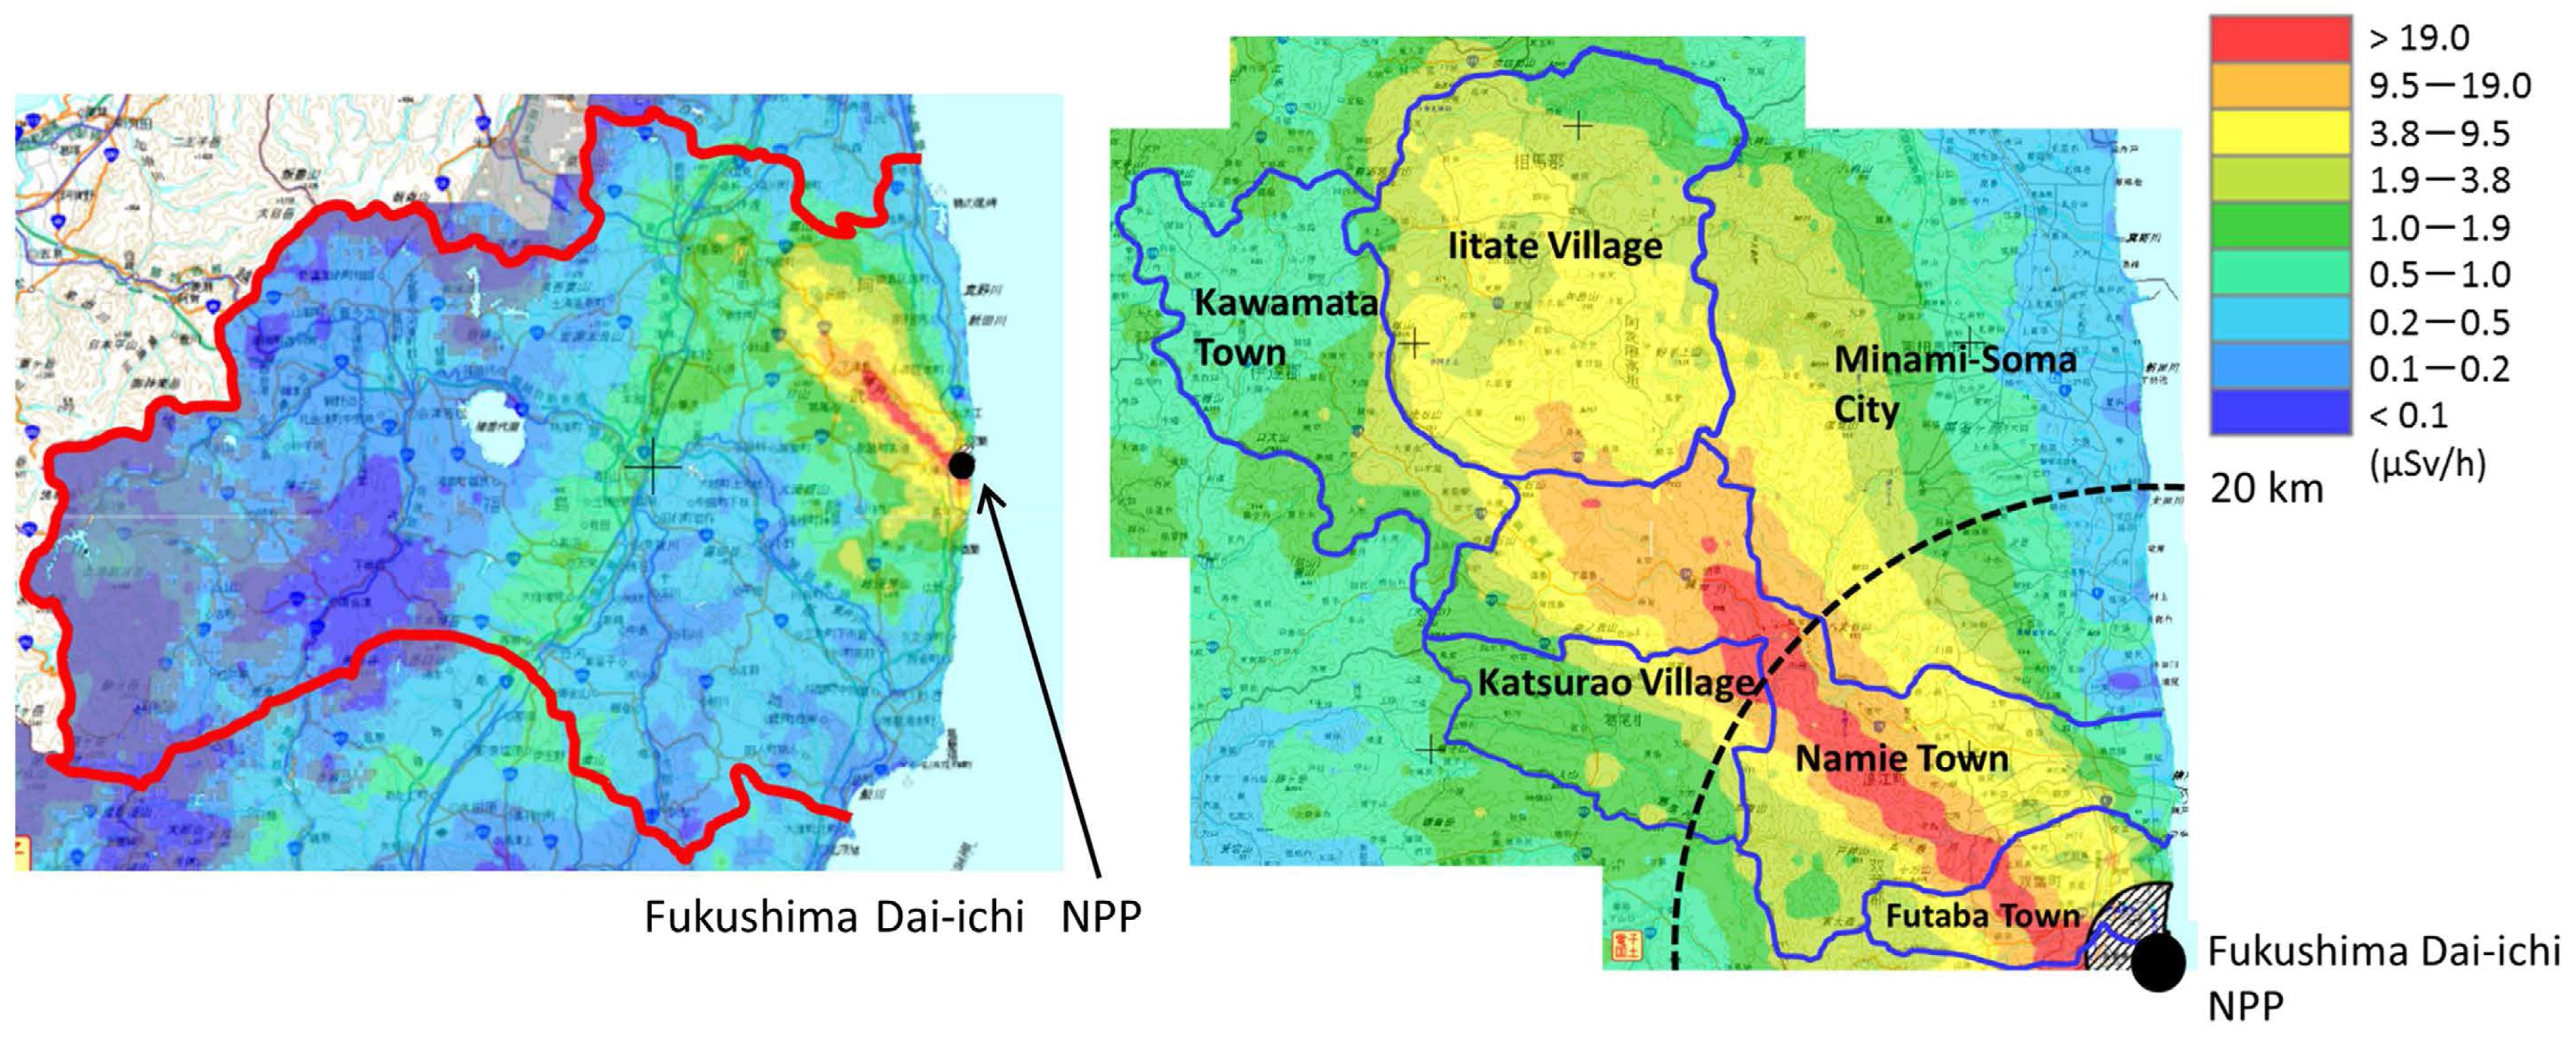
English: Source: Tetsuo Ishikawa, Seiji Yasumura, Kotaro Ozasa, Gen Kobashi, Hiroshi Yasuda, Makoto Miyazaki, Keiichi Akahane, Shunsuke Yonai, Akira Ohtsuru, Akira Sakai, Ritsu Sakata, Kenji Kamiya, Masafumi Abe: "The Fukushima Health Management Survey: estimation of external doses to residents in Fukushima Prefecture", Scientific Reports, 5, 12712, 2015, pp. 1-11, DOI: 10.1038/srep12712, here: p. 6, Figure 4: "Gamma ray dose rate maps of Fukushima Prefecture These maps were modified by using PowerPoint® and Adobe Reader® software, from maps obtained by airborne monitoring surveys made in April to June, 2012". Online published on 4 August 2015, License: Creative Commons Attribution 4.0 International (CC BY 4.0).
Original caption as given in the source mentioned above: "Figure 4. "Gamma ray dose rate maps of Fukushima Prefecture These maps were modified by using PowerPoint® and Adobe Reader® software, from maps obtained by airborne monitoring surveys made in April to June, 2012. No map available on the “Extension Site of Distribution Map of Radiation Dose, etc.,/Digital Japan” (http://ramap.jmc.or.jp/map/eng/) shall be quoted in any other documents without explicitly referring to the site as the source of the map. Decay correction was made for June 28, 2012. (a) The whole prefecture map and (b) a blown-up map focusing on the highest dose rate areas." Original context as given in the source mentioned above: "Figures 3 and 4 (a) show that the gamma ray dose rate was the highest in the Soso area followed by the Kempoku and the Kenchu area. Most of the Soso area was designated as the Evacuation Area or Deliberate Evacuation Area. Many of the Soso residents evacuated from their original location, which is a possible reason for their average dose being lower than the average doses for residents of the Kempoku and Kenchu areas. The average doses for Aizu (0.2 mSv) and Minami-Aizu (0.1 mSv) areas were smaller than those for other areas due to their greater distance from the Fukushima Dai-ichi NPP. A blown-up map of the area with the highest gamma ray dose rate is shown in Fig. 4(b)15. Table 2 lists the dose distribution for each of the six municipalities shown in Fig. 4(b). A more detailed dose distribution is shown in Table S1 in the Supplementary Information. As shown in Table S1, most of the higher doses were reported in Iitate Village and Namie Town. Figure 4(b) indicates that the gamma ray dose rate was generally higher in Namie Town, with similar individual doses seen in Iitate Village (Table S1)." |
| Datum | |
| Quelle | Tetsuo Ishikawa, Seiji Yasumura, Kotaro Ozasa, Gen Kobashi, Hiroshi Yasuda, Makoto Miyazaki, Keiichi Akahane, Shunsuke Yonai, Akira Ohtsuru, Akira Sakai, Ritsu Sakata, Kenji Kamiya, Masafumi Abe: "The Fukushima Health Management Survey: estimation of external doses to residents in Fukushima Prefecture", Scientific Reports, 5, 12712, 2015, pp. 1-11, DOI: 10.1038/srep12712, here: p. 6, Figure 4: "Gamma ray dose rate maps of Fukushima Prefecture These maps were modified by using PowerPoint® and Adobe Reader® software, from maps obtained by airborne monitoring surveys made in April to June, 2012". Online published on 4 August 2015, License: Creative Commons Attribution 4.0 International (CC BY 4.0). |
| Urheber | Tetsuo Ishikawa, Seiji Yasumura, Kotaro Ozasa, Gen Kobashi, Hiroshi Yasuda, Makoto Miyazaki, Keiichi Akahane, Shunsuke Yonai, Akira Ohtsuru, Akira Sakai, Ritsu Sakata, Kenji Kamiya, Masafumi Abe: "The Fukushima Health Management Survey: estimation of external doses to residents in Fukushima Prefecture", Scientific Reports, 5, 12712, 2015, pp. 1-11, DOI: 10.1038/srep12712, here: p. 6, Figure 4: "Gamma ray dose rate maps of Fukushima Prefecture These maps were modified by using PowerPoint® and Adobe Reader® software, from maps obtained by airborne monitoring surveys made in April to June, 2012". Online published on 4 August 2015, License: Creative Commons Attribution 4.0 International (CC BY 4.0). |
| Genehmigung (Weiternutzung dieser Datei) |
Diese Datei ist lizenziert unter der Creative-Commons-Lizenz „Namensnennung 4.0 international“.
|
Lizenz
- Dieses Werk darf von dir
- verbreitet werden – vervielfältigt, verbreitet und öffentlich zugänglich gemacht werden
- neu zusammengestellt werden – abgewandelt und bearbeitet werden
- Zu den folgenden Bedingungen:
- Namensnennung – Du musst angemessene Urheber- und Rechteangaben machen, einen Link zur Lizenz beifügen und angeben, ob Änderungen vorgenommen wurden. Diese Angaben dürfen in jeder angemessenen Art und Weise gemacht werden, allerdings nicht so, dass der Eindruck entsteht, der Lizenzgeber unterstütze gerade dich oder deine Nutzung besonders.
Dateiversionen
Klicke auf einen Zeitpunkt, um diese Version zu laden.
| Version vom | Vorschaubild | Maße | Benutzer | Kommentar | |
|---|---|---|---|---|---|
| aktuell | 12:34, 22. Jul. 2018 | 4.219 × 1.710 (1,05 MB) | Anglo-Araneophilus~commonswiki | {{Information |description ={{en|1=Source: Tetsuo Ishikawa, Seiji Yasumura, Kotaro Ozasa, Gen Kobashi, Hiroshi Yasuda, Makoto Miyazaki, Keiichi Akahane, Shunsuke Yonai, Akira Ohtsuru, Akira Sakai, Ritsu Sakata, Kenji Kamiya, Masafumi Abe: "The Fukushima Health Management Survey: estimation of external doses to residents in Fukushima Prefecture", Scientific Reports, 5, 12712, 2015, pp. 1-11, DOI: 10.1038/srep12712, here: p. 6, Figure 4: "Gamma ray dose rate maps of Fukushima Prefecture These... |
Dateiverwendung
Die folgende Seite verwendet diese Datei:
Globale Dateiverwendung
Die nachfolgenden anderen Wikis verwenden diese Datei:
- Verwendung auf www.wikidata.org