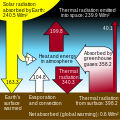
Datei:Greenhouse Effect.svg
Zur Navigation springen
Zur Suche springen

Größe der PNG-Vorschau dieser SVG-Datei: 600 × 600 Pixel. Weitere aus SVG automatisch erzeugte PNG-Grafiken in verschiedenen Auflösungen: 240 × 240 Pixel | 480 × 480 Pixel | 768 × 768 Pixel | 1.024 × 1.024 Pixel | 2.048 × 2.048 Pixel | 960 × 960 Pixel
Originaldatei (SVG-Datei, Basisgröße: 960 × 960 Pixel, Dateigröße: 7 KB)
Dateiversionen
Klicke auf einen Zeitpunkt, um diese Version zu laden.
| Version vom | Vorschaubild | Maße | Benutzer | Kommentar | |
|---|---|---|---|---|---|
| aktuell | 17:12, 23. Jun. 2023 |  | 960 × 960 (7 KB) | Efbrazil | thermal radiation --> longwave radiation as per discussion |
| 18:09, 22. Mai 2023 |  | 960 × 960 (7 KB) | Efbrazil | graphical tweaks | |
| 22:00, 19. Mai 2023 |  | 960 × 960 (7 KB) | Efbrazil | Further tweak to word wrap | |
| 19:56, 19. Mai 2023 |  | 960 × 960 (7 KB) | Efbrazil | Graphic enhancements, content unchanged | |
| 20:05, 11. Mai 2023 |  | 960 × 960 (7 KB) | Efbrazil | Updating diagram to be based on newer data here: https://www.nasa.gov/feature/langley/what-is-earth-s-energy-budget-five-questions-with-a-guy-who-knows | |
| 22:04, 31. Aug. 2021 |  | 750 × 577 (21 KB) | Dragons flight | Revert to earlier version. Change is technically inaccurate. Energy flow balance requires that all forms of energy transfer are included, i.e. the land->atmosphere flow includes not only radiation but also conduction, convection, etc. Also, "heat radiation" appears to be colloquial. | |
| 23:35, 22. Aug. 2021 |  | 750 × 577 (21 KB) | Efbrazil | All heat radiation is now the same color, it is not clear why that was not the case before | |
| 22:31, 22. Aug. 2021 |  | 750 × 577 (21 KB) | Efbrazil | A few text changes to make things more clear | |
| 19:42, 9. Apr. 2020 |  | 750 × 577 (21 KB) | Efbrazil | Minor edit, improving alignment of text with larger font for thumbnail view | |
| 19:06, 30. Mär. 2020 |  | 750 × 577 (21 KB) | Efbrazil | Improved fonts and alignment for thumbnail legibility |
Dateiverwendung
Die folgende Seite verwendet diese Datei:
Globale Dateiverwendung
Die nachfolgenden anderen Wikis verwenden diese Datei:
- Verwendung auf af.wikipedia.org
- Verwendung auf beta.wikiversity.org
- Verwendung auf bg.wikipedia.org
- Verwendung auf ca.wikipedia.org
- Verwendung auf da.wikipedia.org
- Verwendung auf diq.wikipedia.org
- Verwendung auf en.wikipedia.org
- Causes of climate change
- Greenhouse effect
- Climate change
- User:Rugby471/Images
- Urban metabolism
- Talk:Greenhouse effect/Archive 3
- Wikipedia:Valued picture candidates/The Greenhouse Effect
- Wikipedia:Valued picture candidates/September-2009
- Wikipedia:Reference desk/Archives/Science/2009 December 6
- Talk:Greenhouse gas/Archive 4
- Talk:Climate change/Archive 63
- User:Bluebolt94/greenhouse
- Talk:Greenhouse gas/Archive 5
- User talk:JRSpriggs/Archive 5
- Wikipedia:Top 25 Report/November 10 to 16, 2013
- Wikipedia:Top 25 Report/November 17 to 23, 2013
- Wikipedia:Reference desk/Archives/Science/2017 November 14
- User talk:A loose necktie
- User:Daniel Mietchen/gallery
- Talk:Climate change/Archive 81
- Portal:Climate change
- Talk:Greenhouse effect/Archive 7
- Verwendung auf en.wikibooks.org
- Verwendung auf en.wikiversity.org
- Verwendung auf es.wikipedia.org
- Verwendung auf fa.wikipedia.org
- Verwendung auf fr.wikipedia.org
- Verwendung auf ga.wikipedia.org
- Verwendung auf hu.wikipedia.org
- Verwendung auf it.wikipedia.org
- Verwendung auf ko.wikipedia.org
- Verwendung auf lt.wikipedia.org
Weitere globale Verwendungen dieser Datei anschauen.


