Zur Beschreibungsseite auf Commons

Datei:Proximity effect - current in same direction.svg

aus Wikipedia, der freien Enzyklopädie
Zur Navigation springen Zur Suche springen

Originaldatei(SVG-Datei, Basisgröße: 987 × 817 Pixel, Dateigröße: 32 KB)

Diese Datei und die Informationen unter dem roten Trennstrich werden aus dem zentralen Medienarchiv Wikimedia Commons eingebunden.

Zur Beschreibungsseite auf Commons


Beschreibung

Beschreibung
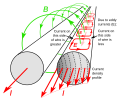
English: Diagram of two adjacent wires carrying an alternating (AC) electric current (I, red arrows) in the same direction, showing the origin of proximity effect. Proximity effect is a redistribution of current in a AC current-carrying conductor, due to currents induced by the time varying magnetic field of an adjacent conductor from Faraday's law of induction. In parallel wires carrying current in the same direction it causes the current to concentrate on the far side of the conductor, away from the neighboring conductor. It is caused by the magnetic field (B, green arrows) of the adjacent wire.

The drawing shows the currents and magnetic field at a point in the AC cycle when the current is increasing. The time varying magnetic field from the lefthand wire passes through the righthand wire, creating circular eddy currents (E) in the wire. During the part of the AC cycle when the current is increasing the eddy currents circle in a clockwise direction as shown, increasing the current density on the right side of the wire (2) and decreasing the density on the left side (1). The resulting current density profile is shown by the red arrows, and color gradient on the cross section of the wire (3), with blue indicating lower current density, and green, yellow, and red progressively greater current density. During the other half of the cycle while the current is decreasing, the eddy currents are in a counterclockwise direction, reversing the current.

The current distribution illustrated by the color gradient is just a hand-drawn approximation, not an exact calculation of the current density.
Español: Diagrama de dos conductores adyacentes por los que circula una corriente eléctrica (I), mostrando el origen del efecto proximidad. El efecto proximidad es una redistribución de la corriente hacia el lado del conductor adyacente. Es causado por el campo magnético (B) del conductor adyacente. El dibujo muestra las corrientes y el campo magnético en un punto del período de la corriente alterna en que la intensidad de corriente aumenta. El campo magnético variable del conductor de la izquierda atraviesa al conductor de la derecha, creando corrientes de Foucault (E) en este. Como se muestra, las corrientes de Foucault incrementan la densidad de corriente en el lado izquierdo del conductor (1) y reducen la densidad en el lado derecho (2). También se muestra el perfil de la densidad de corriente resultante (3).
Datum
Quelle Eigenes Werk
Urheber Chetvorno
Andere Versionen Proximity effect - current in opposite directions.svg shows the case in which the current in the two wires is in opposite directions
SVG‑Erstellung
InfoField
 
Der SVG-Code ist valide.
 
Dieses Diagramm wurde mit Inkscape erstellt.
 
 Dieses Diagramm verwendet Text-Einbettung, die mit einem Texteditor leicht übersetzbar ist.

Lizenz

Ich, der Urheber dieses Werkes, veröffentliche es unter der folgenden Lizenz:
Creative Commons CC-Zero Diese Datei wird unter der Creative-Commons-Lizenz „CC0 1.0 Verzicht auf das Copyright“ zur Verfügung gestellt.
Die Person, die das Werk mit diesem Dokument verbunden hat, übergibt dieses weltweit der Gemeinfreiheit, indem sie alle Urheberrechte und damit verbundenen weiteren Rechte – im Rahmen der jeweils geltenden gesetzlichen Bestimmungen – aufgibt. Das Werk kann – selbst für kommerzielle Zwecke – kopiert, modifiziert und weiterverteilt werden, ohne hierfür um Erlaubnis bitten zu müssen.

Kurzbeschreibungen

Ergänze eine einzeilige Erklärung, was diese Datei darstellt.
Diagram showing the origin of proximity effect

In dieser Datei abgebildete Objekte

Motiv

image/svg+xml

Dateiversionen

Klicke auf einen Zeitpunkt, um diese Version zu laden.

Version vomVorschaubildMaßeBenutzerKommentar
aktuell00:37, 15. Jul. 2023Vorschaubild der Version vom 00:37, 15. Jul. 2023987 × 817 (32 KB)ChetvornoSlightly altered fill color
08:15, 12. Jul. 2023Vorschaubild der Version vom 08:15, 12. Jul. 2023987 × 817 (33 KB)ChetvornoImproved drawing a lot
23:43, 10. Jul. 2023Vorschaubild der Version vom 23:43, 10. Jul. 2023986 × 799 (29 KB)ChetvornoFixed drawing borders
23:36, 10. Jul. 2023Vorschaubild der Version vom 23:36, 10. Jul. 2023953 × 803 (29 KB)ChetvornoCorrected previous drawing that showed the current concentrated on the wrong side of the wire
03:09, 6. Jul. 2019Vorschaubild der Version vom 03:09, 6. Jul. 2019953 × 803 (16 KB)ElucchesReplaced text with numbers. Saved as optimized SVG so that it passes W3C validator. Reemplazo de texto por números. Guardado como SVG optimizado, de modo que sea válido de acuerdo a W3C.<languages/>
18:01, 9. Mai 2017Vorschaubild der Version vom 18:01, 9. Mai 2017953 × 803 (39 KB)ChetvornoReplaced invalid Inkscape SVG with "plain SVG" version which passes validation
16:42, 6. Mai 2017Vorschaubild der Version vom 16:42, 6. Mai 2017953 × 803 (39 KB)ChetvornoUser created page with UploadWizard

Die folgende Seite verwendet diese Datei:

Globale Dateiverwendung

Die nachfolgenden anderen Wikis verwenden diese Datei:

Metadaten