Datei:CPC-NCEP-NOAA Blocking strength GHGS 16 Dec 2018 - 20 Jan 2019.png
Zur Navigation springen
Zur Suche springen

Es ist keine höhere Auflösung vorhanden.
CPC-NCEP-NOAA_Blocking_strength_GHGS_16_Dec_2018_-_20_Jan_2019.png (518 × 221 Pixel, Dateigröße: 4 KB, MIME-Typ: image/png)
![]()
Diese Datei und die Informationen unter dem roten Trennstrich werden aus dem zentralen Medienarchiv Wikimedia Commons eingebunden.
![]()
Beschreibung
| Beschreibung |
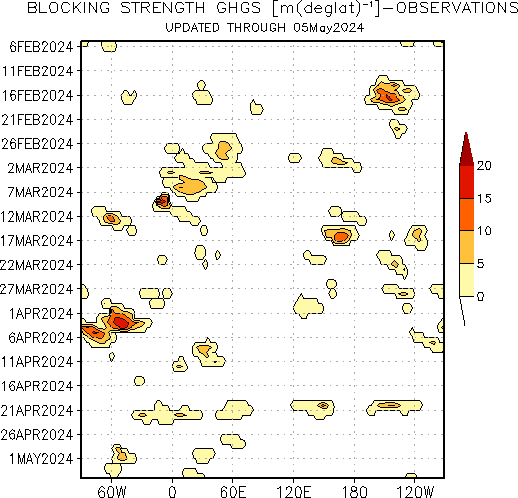
English: All colored regions in the hovmoller plot below depict regions where the flow is blocked according to the blocking index (Tibaldi and Molteni 1990). The color scheme denotes the strength of the blocked flow as determined from the 500 hPa geopotential height gradient measured from the blocking ridge equatorward (denoted GHGS in blocking index definition). The presence of an intense cutoff low equatorward of the blocking ridge can act to enhance the blocking strength. (Text after NOAA, Blocking),
Illustrates 2019 heavy snowfalls in Europe. |
| Datum | |
| Quelle | NOAA NCEP CPC > Climate & Weather Linkage > Blocking: 1panel_ghgs_obs_nh_nrm.gif |
| Urheber |
|
| Andere Versionen |
|

Lizenz
| Diese Datei ist gemeinfrei (public domain), da sie von der NASA erstellt worden ist. Die NASA-Urheberrechtsrichtlinie besagt, dass „NASA-Material nicht durch Urheberrecht geschützt ist, wenn es nicht anders angegeben ist“. (NASA-Urheberrechtsrichtlinie-Seite oder JPL Image Use Policy). | ||
 |
Warnung:
|
Dateiversionen
Klicke auf einen Zeitpunkt, um diese Version zu laden.
| Version vom | Vorschaubild | Maße | Benutzer | Kommentar | |
|---|---|---|---|---|---|
| aktuell | 00:36, 23. Jan. 2019 | | 518 × 221 (4 KB) | W!B: | =={{int:filedesc}}== {{Information |description={{en|1=All colored regions in the hovmoller plot below depict regions where the flow is blocked according to the blocking index (Tibaldi and Molteni 1990). The color scheme denotes the strength of the blocked flow as determined from the 500 hPa geopotential height gradient measured from the blocking ridge equatorward (denoted GHGS in blocking index definition). The presence of an intense cutoff low equatorward of the blocking ridge can act to en... |
Dateiverwendung
Die folgende Seite verwendet diese Datei: