Datei:1880- Global surface temperature - heat map animation - NASA SVS.webm
Originaldatei (WebM-Audio-/Video-Datei, VP9/Opus, Länge: 30 s, 1.920×1.080 Pixel, 1,03 Mbps insgesamt, Dateigröße: 3,67 MB)
![]()
Diese Datei und die Informationen unter dem roten Trennstrich werden aus dem zentralen Medienarchiv Wikimedia Commons eingebunden.
![]()
Beschreibung
| Beschreibung |
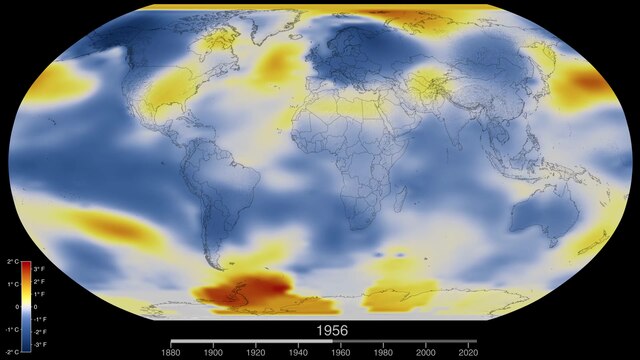
English: Global surface temperature heat map animation for 1880—___. Produced by NASA's Scientific Visualization Studio (SVS) from data from NASA's Goddard Institute for Space Studies.
Version 4+5 (data though 2021)Original source page, titled "Global Temperature Anomalies from 1880 to 2021" Visualizations by Lori Perkins, includes the descriptions:
Version 3 (data though 2020)Original source page, titled "Global Temperature Anomalies from 1880 to 2020" Visualizations by Lori Perkins, includes the descriptions:
Version 2 (data though 2019)Original source page, titled "Global Temperature Anomalies from 1880 to 2019" Visualizations by Lori Perkins, includes the descriptions:
Version 1 (data through 2018)Original source page, titled "Global Temperature Anomalies from 1880 to 2018", includes the descriptions:
|
| Datum |
|
| Quelle |
|
| Urheber | NASA attribution: "Visualizations by Lori Perkins" |
Lizenz
| Diese Datei ist gemeinfrei (public domain), da sie von der NASA erstellt worden ist. Die NASA-Urheberrechtsrichtlinie besagt, dass „NASA-Material nicht durch Urheberrecht geschützt ist, wenn es nicht anders angegeben ist“. (NASA-Urheberrechtsrichtlinie-Seite oder JPL Image Use Policy). | ||
 |
Warnung:
|
Dateiversionen
Klicke auf einen Zeitpunkt, um diese Version zu laden.
| Version vom | Vorschaubild | Maße | Benutzer | Kommentar | |
|---|---|---|---|---|---|
| aktuell | 08:08, 12. Sep. 2022 | 30 s, 1.920 × 1.080 (3,67 MB) | RCraig09 | D'oh! Now uploading video with CELSIUS color scale | |
| 07:46, 12. Sep. 2022 | 30 s, 1.920 × 1.080 (4,84 MB) | RCraig09 | Version 4: updated to include data through 2021 | ||
| 15:27, 11. Jul. 2021 | 30 s, 1.920 × 1.080 (6,65 MB) | RCraig09 | Version 3: Update to include 2020 data, as published by NASA in January 2021 | ||
| 07:03, 21. Apr. 2020 | 33 s, 1.920 × 1.080 (2,67 MB) | RCraig09 | Version 2: NASA video updated with 2019 data. | ||
| 22:51, 21. Sep. 2019 | 33 s, 1.920 × 1.080 (3,15 MB) | RCraig09 | User created page with UploadWizard |
Dateiverwendung
Die folgenden 2 Seiten verwenden diese Datei:
Globale Dateiverwendung
Die nachfolgenden anderen Wikis verwenden diese Datei:
- Verwendung auf cs.wikipedia.org
- Verwendung auf el.wikipedia.org
- Verwendung auf en.wikipedia.org
- Verwendung auf he.wikipedia.org
- Verwendung auf incubator.wikimedia.org
- Verwendung auf sv.wikipedia.org
- Verwendung auf zh.wikipedia.org